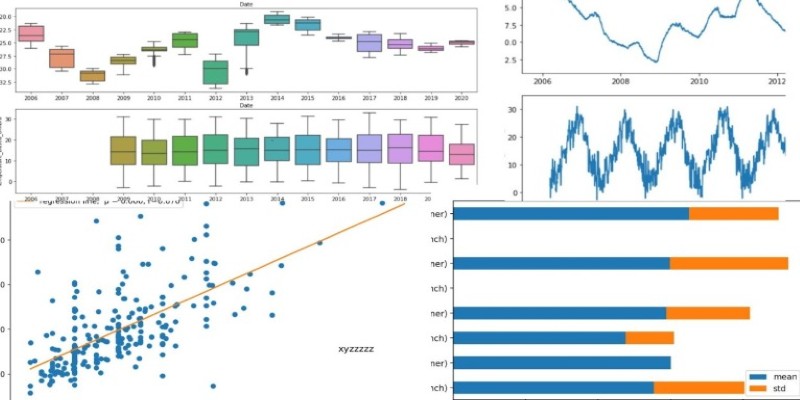
The way we present data can make a huge difference in how easily we understand it. When you're looking at numbers scattered across a spreadsheet, it's easy to feel overwhelmed. But place that same information on a line plot, and suddenly, patterns, changes, and relationships start to jump out. If you've been wanting a clean, easy way to create line plots, Seaborn might just become your go-to tool. Let’s walk through why it works so well and how you can get started.
Why Use Seaborn for Line Plots?
There are lots of plotting libraries out there, but Seaborn tends to stand out for a few simple reasons. First, it builds on top of Matplotlib, which means it’s both flexible and reliable. Second, Seaborn was made with beauty and clarity in mind. Instead of spending half your afternoon tweaking colors, fonts, and grids, Seaborn gives you polished results with minimal effort.
And here’s the real magic: Seaborn doesn't just plot the data. It tries to make sense to you. It comes packed with smart defaults, like automatic confidence intervals for line plots, that help you see more than just the line itself. So, instead of staring at a flat, lifeless chart, you get something that tells a richer story.
Setting Up Seaborn: Quick and Painless

If you haven't used Seaborn before, don't worry. Setup takes less time than making a coffee. All you need is a working Python environment. You can install Seaborn with one simple line:
python
CopyEdit
pip install seaborn
Once it’s installed, you can start using it right away. Typically, people also import Matplotlib alongside it because Seaborn relies on it under the hood to display plots.
Here’s the standard import you’ll often see:
python
CopyEdit
import seaborn as sns
import matplotlib.pyplot as plt
And just like that, you’re ready to start plotting.
How to Create a Line Plot with Seaborn
Now comes the fun part — actually making a line plot. Seaborn’s lineplot() function is where all the actions happen. Let's break it down.
Suppose you have a dataset showing monthly sales numbers. In raw form, it’s not very exciting. But a line plot can bring it to life:
python
CopyEdit
import seaborn as sns
import matplotlib.pyplot as plt
# Sample data
months = ['Jan,' 'Feb,' 'Mar,' 'Apr,' 'May,' 'Jun']
sales = [200, 220, 250, 270, 300, 320]
# Create the plot
sns.lineplot(x=months, y=sales)
# Show it
plt.show()
And just like that, you get a clean, professional-looking plot.
Working with DataFrames
In real-world cases, your data will often live inside a DataFrame. Seaborn works beautifully with pandas, making it effortless to plot directly from a table of information.
Here’s an example using a simple DataFrame:
python
CopyEdit
import pandas as pd
# Create a DataFrame
data = pd.DataFrame({
'Month': months,
'Sales': sales
})
# Plot directly from DataFrame
sns.lineplot(data=data, x='Month', y='Sales')
plt.show()
Notice how readable it is? You’re basically telling Seaborn, “Here’s my data, here’s what I want on the x-axis, and here’s what I want on the y-axis.” No need to jump through hoops.
Customizing Your Line Plot

Sometimes, you'll want your plot to do more than just show a line. Maybe you want different colors, styles, or even multiple lines on the same chart. Seaborn gives you tons of simple ways to tweak your plots without getting buried in technical details.
Adding Style and Color
Want a dashed line? A different color? Both are easy:
python
CopyEdit
sns.lineplot(data=data, x='Month', y='Sales', linestyle='--', color='green')
plt.show()
Plotting Multiple Lines
If you have more than one category and want to compare them, Seaborn has you covered. Just add a hue parameter.
Let’s say you track sales for two products:
python
CopyEdit
# New sample data
data = pd.DataFrame({
'Month': months * 2,
'Sales': [200, 220, 250, 270, 300, 320, 180, 210, 240, 260, 280, 310],
'Product': ['A'] * 6 + ['B'] * 6
})
# Plot with hue
sns.lineplot(data=data, x='Month', y='Sales', hue='Product')
plt.show()
Now, Seaborn automatically draws two lines, each in a different color, and adds a legend for you. No extra effort is needed.
Controlling Confidence Intervals
By default, Seaborn draws a shaded region around each line showing uncertainty, which is called a confidence interval. Sometimes you want that; sometimes you don't.
If you want to turn it off:
python
CopyEdit
sns.lineplot(data=data, x='Month', y='Sales', hue='Product', ci=None)
plt.show()
Nice and clean.
Choosing Different Markers
Adding markers can help highlight individual data points:
python
CopyEdit
sns.lineplot(data=data, x='Month', y='Sales', hue='Product', marker='o')
plt.show()
Each point becomes easier to spot, and the whole plot looks a little more lively.
Handling Larger and Messier Datasets
Not all datasets are small and neat. Sometimes, you're dealing with hundreds or thousands of points. Seaborn doesn’t buckle under that pressure — but it does offer ways to make those plots readable.
Reducing Noise
If your dataset is noisy, plotting every single point can create a messy graph. You can smooth things out by adjusting how Seaborn estimates trends, using options like estimator='mean' or rolling averages.
Here’s an example using a larger dataset:
python
CopyEdit
# Simulate noisy data
import numpy as np
np.random.seed(0)
days = np.arange(1, 101)
sales = 50 + np.random.normal(0, 10, 100).cumsum()
data = pd.DataFrame({
'Day': days,
'Sales': sales
})
# Plot
sns.lineplot(data=data, x='Day', y='Sales')
plt.show()
Even with 100 points, Seaborn keeps it smooth and easy to read. And if you want to smooth it more, you can compute a moving average before plotting.
Wrapping Up
Seaborn’s line plots are like a breath of fresh air when you need to make sense of your data. They're easy to create and easy to customize, and they make your information clear at a glance. Whether you're plotting six points or six hundred, Seaborn’s thoughtful design choices do a lot of the heavy lifting so you can focus on what the data actually means.
If you’re working with data and you want it to tell a better story, trying out Seaborn’s line plots is a smart move. All it takes is a few lines of code to turn rows of numbers into something you can see and understand at a glance.


